
Unlock AI potential with proven data prep strategies. Discover essential techniques to clean, transform, and optimize data for superior ML models in 2025.
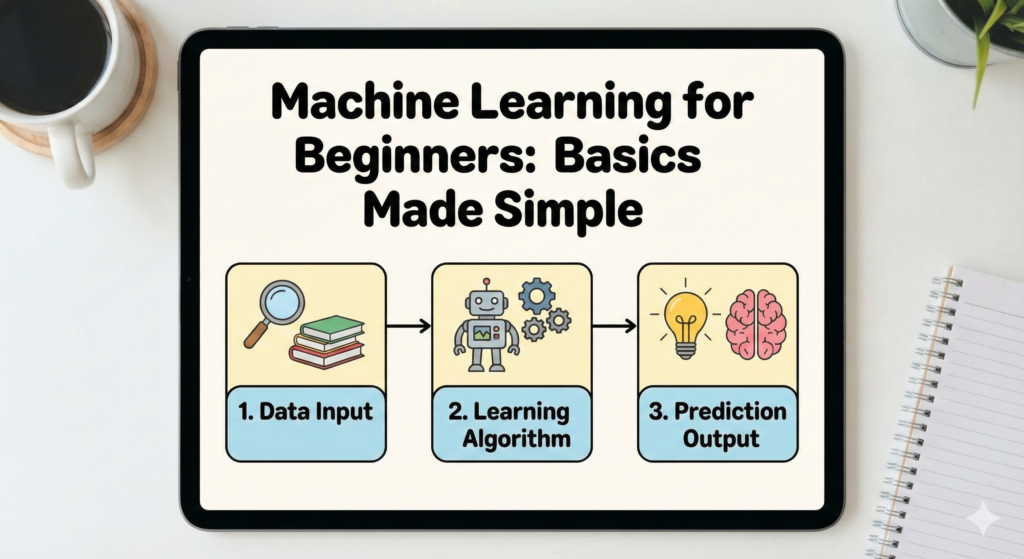
The digital landscape of December 2025 is unforgiving. In this era of hyper-competitive technology, data is no longer just an asset. It is the lifeblood of innovation. However, raw data is messy, chaotic, and often deceptive. To build machine learning models that truly thrive, you must master the art of data preparation. This is not merely a technical step. It is the absolute foundation of your success. Without pristine data, even the most sophisticated algorithms will fail. They will crumble. Consequently, your project will suffer.
We are witnessing a revolutionary shift in how we approach Artificial Intelligence. The focus has moved from model-centric to data-centric AI. This shift is vital. It is urgent. If you neglect data preparation, you are guaranteed to face the “Garbage In, Garbage Out” nightmare. This guide is your essential roadmap. It covers everything from cleaning dirty datasets to advanced feature engineering. We will explore proven strategies that transform raw information into powerful insights.
Preparing data is a rigorous process. It demands attention to detail. It requires a deep understanding of your domain. Moreover, it is the most time-consuming part of any ML project. Yet, it is also the most rewarding. When you get this right, your models perform with incredible accuracy. Your predictions become reliable. Your business impact becomes undeniable. Let us embark on this critical journey to unlock the true power of your data.
The Uncomfortable Truth About Data Quality
Most aspiring data scientists rush to the modeling phase. They want to use the latest neural networks immediately. This is a fatal mistake. Real-world data is never clean. It is riddled with errors. It contains missing values. It hides outliers that can skew your results. Therefore, skipping the preparation phase is a recipe for disaster. You must embrace the grind of cleaning your data.
Industry experts agree on a shocking statistic. Data scientists spend nearly 80% of their time preparing data. Only 20% is spent on modeling. This ratio is essential for success. It highlights the critical importance of this phase. If you ignore this reality, you will struggle. Your models will be mediocre at best. At worst, they will be dangerous.
Consider the consequences of poor data quality. A financial model trained on flawed data could lose millions. A medical diagnosis system could miss a critical symptom. These are not hypothetical scenarios. They are real risks. Thus, ensuring data quality is not optional. It is mandatory. It is the only way to build trust in your AI systems.
The High Cost of Ignoring Data Hygiene
Dirty data is a silent killer of machine learning projects. It creeps in unnoticed. It undermines your hard work. Often, you might not realize there is a problem until it is too late. The model performs well in training but fails in production. This is a classic sign of data leakage or poor preprocessing.
You must be vigilant. You must be ruthless in your pursuit of quality. Every row of data matters. Every feature counts. Furthermore, the cost of fixing data errors increases exponentially as you move down the pipeline. Fixing a data issue during the preparation phase is cheap. Fixing it after deployment is expensive. It damages your reputation. It erodes user trust.
Therefore, adopt a proactive mindset. Treat your data with the respect it deserves. Clean it. Polish it. Validate it. Only then should you feed it to your algorithms. This discipline is what separates the amateurs from the professionals. It is the secret to building robust, high-performing machine learning systems.
Exploratory Data Analysis: The Detective Work
Before you can clean your data, you must understand it. This is where Exploratory Data Analysis (EDA) comes into play. EDA is the process of analyzing datasets to summarize their main characteristics. It is like being a detective. You are looking for clues. You are hunting for patterns. You are identifying anomalies.
Visualizing your data is powerful. It reveals insights that raw numbers cannot. Histograms show you the distribution of your variables. Scatter plots reveal relationships between features. Box plots highlight outliers. Consequently, visualization tools are your best friends. They allow you to see the “shape” of your data.
Moreover, EDA helps you formulate hypotheses. It guides your data cleaning strategy. If you see a lot of missing values in a column, you know you need a plan to handle them. If you see a strong correlation between two variables, you might decide to drop one. This phase is critical. It informs every decision you make subsequently.
Visualizing Distributions and Relationships
Understanding the distribution of your data is vital. Is it normal? Is it skewed? Many machine learning algorithms assume a normal distribution. If your data is skewed, you might need to transform it. We will discuss transformations later. for now, just know that spotting skewness is essential.
Relationships between variables are equally important. Correlation matrices are a standard tool here. They show you how variables interact with each other. A high correlation between two independent variables is called multicollinearity. This can be problematic for some models, like linear regression. It makes the model unstable. Therefore, detecting and addressing multicollinearity is a key step in EDA.
Additionally, look for unexpected patterns. Does sales data drop to zero on weekends? Is that a real trend or a data collection error? These questions are crucial. They require domain knowledge. You must understand what the data should look like to know when it looks wrong.
Strategies for Handling Missing Data
Missing data is a common plague. It happens in almost every real-world dataset. Sensors fail. Users skip optional fields. Systems crash. Ignoring missing data is dangerous. Most algorithms cannot handle it. They will crash. Or worse, they will make biased predictions.
You have several options. You can drop the rows with missing values. This is easy. However, it is risky. You might lose valuable information. If you have a small dataset, dropping rows is a luxury you cannot afford. Therefore, you often need a smarter strategy.
Imputation is the technique of filling in missing values. You can fill them with the mean. You can use the median. You can use the mode. These are simple methods. They work well for many problems. However, they can also distort the distribution of your data.
Advanced Imputation Techniques
For more complex scenarios, you need powerful tools. K-Nearest Neighbors (KNN) imputation is a popular choice. It finds similar data points and uses them to estimate the missing value. This preserves the local structure of the data. It is more accurate than simple mean imputation.
Another robust method is iterative imputation. This models each feature with missing values as a function of other features. It is like training a mini-machine learning model just to fill in the blanks. This is highly effective. It captures complex relationships between variables.
(Simple Mean Imputation Formula)
Remember, the goal is not just to fill the holes. It is to preserve the integrity of the data. You want to introduce as little bias as possible. Always document your imputation strategy. Be transparent about how you handled the missing data. This builds trust in your results.
Outlier Detection and Management
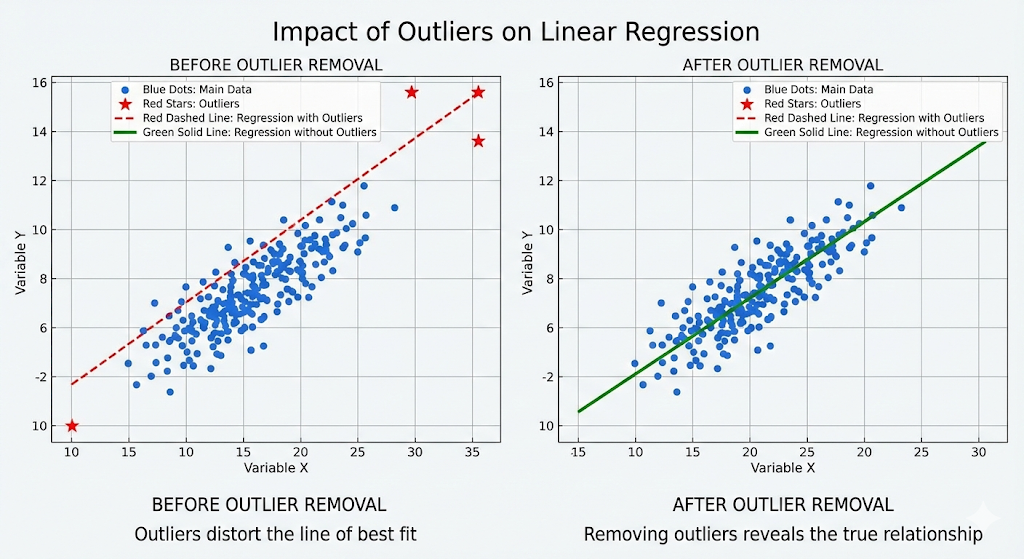
Outliers are data points that differ significantly from other observations. They are the rebels of your dataset. Sometimes, they are errors. A human age of 200 is clearly an error. Other times, they are valid but extreme cases. A billionaire’s income is an outlier, but it is real.
Detecting outliers is essential. They can ruin the performance of models like linear regression. They pull the “line of best fit” away from the majority of the data. This degrades the model’s accuracy. Therefore, you must identify them.
Visual methods like box plots are great for spotting outliers. Statistical methods are also powerful. The Z-score tells you how many standard deviations a point is from the mean. A Z-score greater than 3 is usually considered an outlier. The Interquartile Range (IQR) method is another robust technique.
To Drop or Not to Drop?
Once you find outliers, you face a dilemma. Should you remove them? Not always. If the outlier is a genuine error, delete it. If it is a valid data point, think twice. Removing it might make your model less generalizable. It might fail to predict extreme events in the future.
Alternatively, you can cap the outliers. This is called “Winsorization.” You replace extreme values with a specified percentile value. For example, you might replace all values above the 99th percentile with the value at the 99th percentile. This reduces the impact of the outlier without losing the data point entirely.
Deciding how to handle outliers requires judgment. It requires domain expertise. Is this anomaly a fraud attempt? Or is it a system glitch? Your answer determines your action. Be careful. Be deliberate.
The Art of Feature Engineering
Feature engineering is the secret sauce of machine learning. It is where you apply your creativity. It is where you add unique value. Feature engineering involves creating new features from existing ones. It transforms raw data into formats that are easier for the model to understand.
This process is critical. A good feature can improve model performance more than a complex algorithm. For example, extracting the “day of the week” from a timestamp is feature engineering. Creating a “debt-to-income ratio” from “debt” and “income” columns is feature engineering. These new features capture patterns that the raw data hides.
You must think like the model. What information does it need to solve the problem? If you are predicting house prices, the “price per square foot” might be more useful than just the “total price.” By creating this ratio, you give the model a direct signal of value.
Transformation and Scaling
Data often comes in different scales. One feature might range from 0 to 1. Another might range from 1,000 to 1,000,000. This disparity confuses many algorithms. Gradient descent-based algorithms, like neural networks, struggle with unscaled data. They converge slowly. Sometimes they do not converge at all.
Scaling solves this problem. It brings all features to a similar range. Min-Max Scaling squeezes values between 0 and 1. Standardization (Z-score normalization) centers the data around 0 with a standard deviation of 1.
You must apply these transformations correctly. Always fit the scaler on the training data only. Then, transform the test data using the same parameters. Never fit on the test data. That causes data leakage. It is a cardinal sin in machine learning.
Encoding Categorical Data
Machine learning models speak math. They understand numbers. They do not understand text. If your data contains categories like “Red,” “Green,” or “Blue,” you must convert them into numbers. This process is called encoding.
Label Encoding assigns a unique number to each category. “Red” becomes 1, “Green” becomes 2. This is simple. However, it introduces a problem. The model might think “Green” is greater than “Red.” It implies an order where none exists. This can mislead the algorithm.
One-Hot Encoding is often a better solution. It creates a new binary column for each category. You get a “Is_Red” column, a “Is_Green” column, and so on. This avoids the ordinal problem. It treats all categories equally. However, it can increase the dimensionality of your data significantly. This is known as the “Curse of Dimensionality.”
Dealing with High Cardinality
What if you have a categorical feature with thousands of unique values? Like “Zip Code”? One-Hot Encoding would create thousands of new columns. This is inefficient. It slows down training. It consumes memory.
Target Encoding is a powerful alternative for high-cardinality features. It replaces the category with the average value of the target variable for that category. It is highly effective. But beware of overfitting. You must use regularization techniques when using Target Encoding.
Frequency encoding is another simpler method. It replaces the category with the count of its occurrences. This tells the model how common or rare a category is. It preserves information without exploding the number of features.
Preventing Data Leakage
Data leakage is a treacherous trap. It occurs when information from outside the training dataset is used to create the model. This gives the model an unfair advantage during training. It cheats. The result is a model that looks amazing on paper but fails in the real world.
You must be vigilant. Never use future information to predict the past. If you are predicting stock prices for tomorrow, you cannot use tomorrow’s trading volume as a feature. That is leakage.
Preprocessing leakage is subtle. As mentioned earlier, calculating statistics (like mean or variance) on the entire dataset before splitting is leakage. You must split your data first. Then, calculate statistics on the training set. Finally, apply those statistics to the test set.
The Golden Rule of Splitting
Always split your data before you do anything else. This is the golden rule. Create a training set and a testing set immediately. Lock the test set away in a vault. Do not look at it. Do not touch it until the very end.
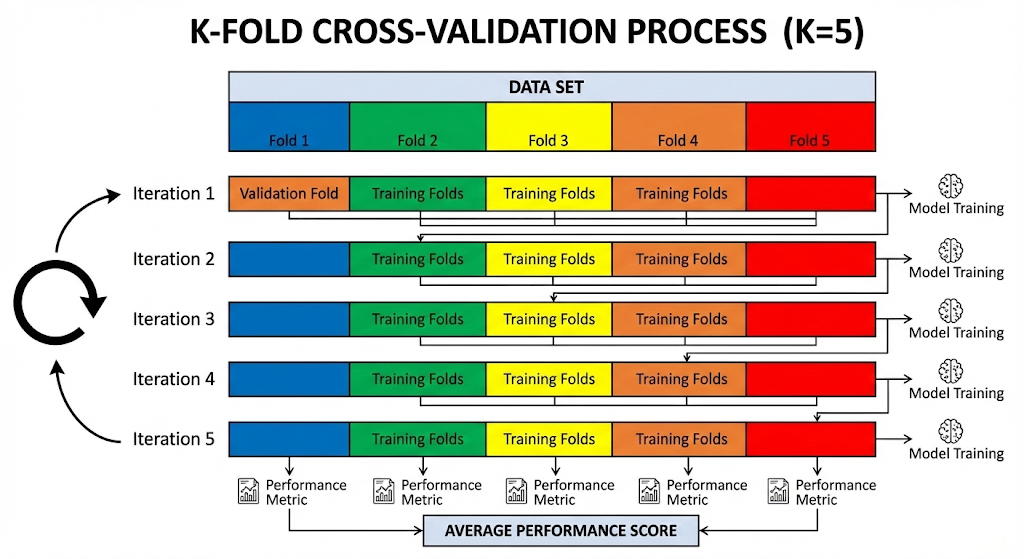
Cross-validation is a robust technique to evaluate model performance. It splits the training data into multiple “folds.” You train on some folds and validate on the others. This gives you a more reliable estimate of how your model will perform on unseen data. It protects you from overfitting to a specific subset of data.
Future Trends in Data Prep for 2025
As we navigate through December 2025, automation is transforming data preparation. AutoML tools are becoming sophisticated. They can automatically detect missing values. They can suggest optimal transformations. They can even engineer features for you.
Synthetic data generation is another breakthrough. Generative Adversarial Networks (GANs) can create realistic, anonymous data. This is vital for privacy-sensitive industries like healthcare and finance. You can train models on synthetic data without risking patient confidentiality.
However, automation does not replace the human element. You still need to understand the data. You still need to validate the results. The tools are powerful, but they are not magic. Your expertise is still the critical differentiator.
Conclusion
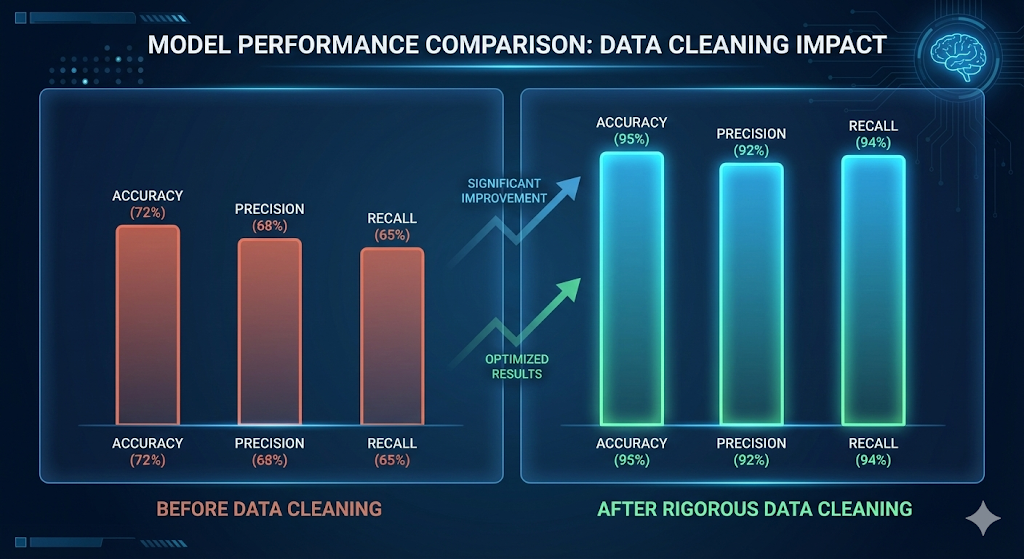
Preparing your data is the most significant investment you can make in your machine learning project. It is hard work. It is often tedious. But it is absolutely essential. By mastering these techniques, you ensure your models are built on a solid foundation. You transform raw noise into a signal. You turn chaos into clarity.
The path to machine learning success is paved with clean data. Do not cut corners. Do not settle for “good enough.” Strive for excellence in your data preparation. The results will speak for themselves. Your models will be accurate. Your insights will be actionable. Your success will be guaranteed.
Now, take this knowledge. Apply it to your datasets. Scrutinize every column. Question every outlier. Engineer features that unlock hidden value. The future of AI belongs to those who respect the data. Be one of them.
Sources and References
- Scikit-learn Documentation: Preprocessing Data
- TensorFlow: Data Validation
- Towards Data Science: The Ultimate Guide to Data Cleaning
- IBM: What is Exploratory Data Analysis?
- Google Cloud: Data Engineering for ML
- Kaggle: Data Cleaning Challenge
- AWS Machine Learning: Data Processing
- Journal of Big Data: Survey on Data Preprocessing